
Residential transactions still considerably down compared with 2015’s banner November, but totals are recovering towards 10-year norms, says board
Residential real estate transactions for the Greater Vancouver area in November were only slightly lower than October sales,although a little lower than the 10-year average for the month, according to the latest market statistics published by Real Estate Board of Greater Vancouver (REBGV) December 2.
Home sales in the region dropped 37.2 per cent year over year, but by less than one per cent compared with October 2016, the board reported.
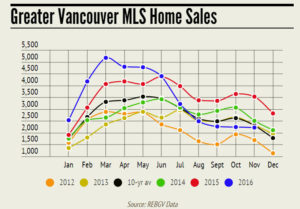
The report added that total transactions were 7.6 per cent below the 10-year average for November (see infographic below) – which is a recovery from the previous month’s sales dip of 15 per cent below historical norms.
“While 2016 has been anything but a normal year for the Metro Vancouver housing market, supply and demand totals have returned to more historically normal levels over the last few months,” said Dan Morrison, president of the REBGV.
Benchmark prices remain elevated, although market conditions are causing them to drop slightly. The composite benchmark home price in November was down 1.2 per cent compared with the previous, at $908,300 – which is still a rise of 20.5 per cent compared with November 2015.
The holding pattern currently seen in the market caused both new and active listings to drop compared with the previous month, the same month last year and the 10-year average.
Sales and Listings
There were 2,214 Greater Vancouver home sales in November, a drop of 37.2 per cent compared with the 3,524 residential transactions in November 2015, but a fall of just 0.9 per cent from October this year – the same as the previous month. November home sales were also 7.6 per cent below the 10-year sales average for the month.
Once again the sharpest year-over-year sales decline was for detached homes, of which there were 638 sales in November, a drop of 52.2 per cent from November 2015, and 2.1 per cent lower than October this year.
Townhomes, duplexes and other attached properties saw 376 unit transactions in November, a year-over-year decline of 40.9 per cent fall and a drop of 6.7 per cent over October’s sales.
Bucking the trend again, sales of condo-apartment totalled 1,200 in November, a fall of 22.7 per cent compared with November 2015 but a month-over-month increase of 1.9 per cent.
Sellers continued to show uncertainty with market conditions, with many holding off listing properties until the situation stabilizes. Greater Vancouver’s new MLS® listings in November saw a 7.2 per cent year-over-year drop to 3,147 units. This is a further drop of 20.9 per cent compared with October’s new listings.
The overall number of active listings on the MLS® in Metro Vancouver, as of the end of November, was 8,385 – a rise of 3.6 per cent compared with November 2015, reflecting this November’s comparatively slower sales, but a drop of 8.3 per cent compared with October this year.
The sales-to-active-listings ratio for November stood at 26.4 per cent, two per cent higher than the 24.4 per cent of in October – still defined as a sellers’ market. However, this ratio varies wildly by city, neighbourhood and property type, with detached homes in some areas now in balanced market territory. For a balanced market, the ratio needs to be between 12 and 20 per cent, according to analysts.
Benchmark Prices
As with the previous month, the REBGV set a somewhat lower composite benchmark price in November, reflecting the changing market conditions. The price of a typical Greater Vancouver home now stands at $908,300, 1.2 per cent lower than October’s $919,300, but 20.5 per cent higher than in November 2015. The record benchmark price to date was set in August this year at $933,100.
In terms of the three key property types, a Greater Vancouver single-family home in November was typically priced at $1,511,100, down 2.2 per cent compared with October’s $1,545,800 (September’s price set a record $1,579,400), but a rise of 23 per cent year over year.
The benchmark price of attached properties such as townhomes and row homes also fell slightly in November to $667,100, a drop of just 0.3 per cent from October’s $669,200, and 23 per cent above that of November 2015.
The condo-apartment benchmark price in November was virtually unchanged from the previous month at $512,100, down just $300. This prices was a rise of 18 per cent over November 2015.
“Demand, relative to supply, for detached homes is lower right now than demand for townhomes and apartments,” Morrison said. “This is causing prices to remain stable, or flat, for townhomes and apartments, while detached homes are seeing modest month-over-moth declines.”
Home prices vary widely throughout the REBGV region. To get a good idea of home prices in a specific location, check the detailed MLS® Home Price Index in the REBGV full statistics package.